

Zeek IDS Installation on Raspberry PI Part 3
Updated 03-14-2021 – added new beats, golang version, extra warnings
Updated 10-02-2021 – Redid screenshots reflecting Elastic 7.15, move to Zeek filebeat module & pre-canned reports
Hi Folks! It has been awhile, thank you for your patience. I have been doing some work in respect to the visualization of Zeek logs. This is a long entry, but a good one that can really add value to your Zeek installation. I hope the write up below will come in handy to setup your own log collector and visualization server with Elasticsearch. I’ve modified this post to use the Zeek filebeat module to use the pre-canned reports and auto-populate the Security menus in Elastic. If you’ve followed the first and second instalments of this series you should be good to go for this portion.
The objectives will be to:
- Setup a VM separate from your Raspberry PI with Linux;
- Install Elasticsearch, Logstash, Kibana (ELK Stack) and Nginx on the VM;
- Install Filebeat from your Zeek sensor on Raspberry Pi;
- Make sure everything is working (logs, queries, services);
Virtual Machine Creation
I have an old PC that has been repurposed into a virtual machine host. I use VirtualBox as my hypervisor, but using VMware works as well.
For the purposes of this project, I downloaded an Ubuntu 20.04 LTS server image and installed it with the following settings:
- 4 GB of RAM;
- 100 GB Hard Drive;
- 2 CPUs;
- Bridged network adapter.
I won’t go into the specifics of how to setup VirtualBox and setting up the VM. A quick web search can show many ways to go about this. I used the automated install utility in Ubuntu and made sure my network card had a static IP address and used all the hard drive space through the partition tool. Make sure you install ssh to login to your new server and apply the latest patches through
sudo apt-get update;apt-get dist-upgrade
Installing Elasticsearch, Logstash and Kibana (ELK) on the VM
Again, not to turn this into a HOWTO on Elasticsearch installation, I used the instructions provided at:
Make sure you pay particular attention to the JAVA and Nginx installation instructions. It’s mostly installed from binaries available at Elastic. I am not an expert in Elasticsearch, I just took the stock settings. This will get the vanilla Elasticsearch app going. No SSL, no extras with the X-pack modules.
Install Filebeat on your Zeek Sensor
Here comes the fun part. Because Elastic doesn’t compile it’s binaries for ARM architecture, we will have to compile Filebeat from source with multiple dependencies. Filebeat also makes use of Golang. If you want to save yourself some grief, you can also clone and run Josh Thurston’s easyBeats github repository which will do much of the heavy lifting explained below:
The steps to retrieve and install are as follows:
First we need pip and git.
sudo apt-get install python-pip git
Then virtualenv.
sudo pip install virtualenv
We’re ready to download and decompress Go (for raspi) and set the environment variable in the shell.
wget https://dl.google.com/go/go1.16.3.linux-armv6l.tar.gz
sudo tar -C /usr/local -xzf go1.16.3.linux-armv6l.tar.gz
export PATH=$PATH:/usr/local/go/bin
Then we test to make sure all is running as it should type in go version:
go version

go version go1.16.3 linux/arm
Now we setup the environment for filebeat:
export GOPATH=$HOME/go
mkdir go
mkdir -p ${GOPATH}/src/github.com/elastic
cd ${GOPATH}/src/github.com/elastic
Finally we retreive and build filebeat. You should be in the ~/go/src/github.com/elastic directory.
3 things to watch out for.
- On some installs I had an issue with memory filling up and not swapping. I usually reboot the device before building filebeat.
- This is the filebeat version I installed from the git repository at the time of writing. It may not be the most recent version or the version you want to use. You can consult the different branches here: https://github.com/elastic/beats. As of the writing of this, the latest release of beats on github is 8.0 (Oct 2021)
- I compiled with the newest version of GO (1.16.x), but was having x.509 issues in the logs. If anyone with Golang experience can get the environment variable: GODEBUG=x509ignoreCN=0, and have it work in filebeat without error, let me know, or just use SANs in your x.509 cert as well…
The commands to input are in italics, the messages are in normal text.
git clone https://github.com/elastic/beats.git
cd beats/
cd filebeat/
make
On make, the prompt should appear similar to this:
go build -ldflags "-X github.com/elastic/beats/libbeat/version.buildTime=2021-03-14T16:50:53Z -X github.com/elastic/beats/libbeat/version.commit=1d9cced55410003f5d0b4594ff5471d15a4e2900"
If things went swimmingly you should have a new executable file named filebeat. To perform some tests to see that it’s responsive you can type:
./filebeat -e -v
You should see some messages outlining the log and executable paths.
Next is to setup the ‘standard’ directories and files for configuration.
sudo mkdir /usr/share/filebeat /usr/share/filebeat/bin /etc/filebeat /var/log/filebeat /var/lib/filebeat
sudo mv filebeat /usr/share/filebeat/bin
sudo mv module /usr/share/filebeat/
sudo mv modules.d/ /etc/filebeat/
sudo cp filebeat.yml /etc/filebeat/
sudo chmod 750 /var/log/filebeat
sudo chmod 750 /etc/filebeat/
sudo chown -R root:root /usr/share/filebeat/*
Create the file for the filebeat service to make it start on boot and can be stopped through the service layer. Use your own favorite text editor for this (I like joe for my default editor).
sudo joe /lib/systemd/system/filebeat.service
Fill in the file with:
[Unit]
Description=filebeat
Documentation=https://www.elastic.co/guide/en/beats/filebeat/current/index.html
Wants=userwork-online.target
After=network-online.target

[Service]
Environment="GODEBUG='madvdontneed=1'"
Environment="BEAT_LOG_OPTS="
Environment="BEAT_CONFIG_OPTS=-c /etc/filebeat/filebeat.yml"
Environment="BEAT_PATH_OPTS=--path.home /usr/share/filebeat --path.config /etc/filebeat --path.data /var/lib/filebeat --path.logs /var/log/filebeat"
ExecStart=/usr/share/filebeat/bin/filebeat --environment systemd $BEAT_LOG_OPTS $BEAT_CONFIG_OPTS $BEAT_PATH_OPTS
Restart=always

[Install]
WantedBy=multi-user.target
And now to add the service to the regular rotation of services:
sudo systemctl enable filebeat.service
Created symlink /etc/systemd/system/multi-user.target.wants/filebeat.service → /lib/systemd/system/filebeat.service.
sudo service filebeat start
sudo service filebeat status
● filebeat.service - filebeat
   Loaded: loaded (/lib/systemd/system/filebeat.service; enabled; vendor preset:
   Active: active (running) since Sun 2020-06-28 16:25:20 BST; 8s ago
     Docs: https://www.elastic.co/guide/en/beats/filebeat/current/index.html
 Main PID: 18536 (filebeat)
    Tasks: 14 (limit: 4915)
   Memory: 7.7M
   CGroup: /system.slice/filebeat.service
           └─18536 /usr/share/filebeat/bin/filebeat -c /etc/filebeat/filebeat.ym

Jun 28 16:25:20 raspi systemd[1]: Started filebeat.
The filebeat configuration file can be found in /etc/filebeat/filebeat.yml. You’ll want to modify it to reflect:
- Where your elasticsearch server IP is (replace xxx with the IP of your server.)
My filebeat.yml looks like this, changed this to input directly to elasticsearch and remove logstash. The areas I modified are in kibana, elasticsearch and added the setup.ilm lines at the end of the file. Also if you go to Tag Country, State and City Information to Zeek Elasticsearch Entries you can add some geotagging information for your local traffic from this filebeat config file.
setup.kibana:
  host: "xxx.xxx.xxx.xxx:5601"

output.elasticsearch:
  hosts: ["http://xxx.xxx.xxx.xxx:9200"]


setup.ilm.rollover_alias: "filebeat-%{[agent.version]}"
setup.ilm.pattern: "{now/M{yyyy.MM}}-000001"
Next to modify the /etc/filebeat/modules.d/zeek.yml file to ensure filebeat picks up the distinct logs Zeek can produce. You can mix and match what logs are most important to you. Also remember the more logs, the more power needed to crunch and transmit to the Elastic hub. My zeek.yml file is below:
# Module: zeek
# Docs: https://www.elastic.co/guide/en/beats/filebeat/7.11/filebeat-module-zeek.html

- module: zeek
  capture_loss:
    enabled: true
    var.paths: ["/usr/local/zeek/logs/current/capture_loss.log"]
  connection:
    enabled: true
    var.paths: ["/usr/local/zeek/logs/current/conn.log"]
  dce_rpc:
    enabled: true
    var.paths: ["/usr/local/zeek/logs/current/dce_rpc.log"]
  dhcp:
    enabled: true
    var.paths: ["/usr/local/zeek/logs/current/dhcp.log"]
  dnp3:
    enabled: true
    var.paths: ["/usr/local/zeek/logs/current/dnp3.log"]
  dns:
    enabled: true
    var.paths: ["/usr/local/zeek/logs/current/dns.log"]
  dpd:
    enabled: true
    var.paths: ["/usr/local/zeek/logs/current/dpd.log"]
  files:
    enabled: true
    var.paths: ["/usr/local/zeek/logs/current/files.log"]
  ftp:
    enabled: true
    var.paths: ["/usr/local/zeek/logs/current/ftp.log"]
  http:
    enabled: true
    var.paths: ["/usr/local/zeek/logs/current/http.log"]
  intel:
    enabled: true
    var.paths: ["/usr/local/zeek/logs/current/intel.log"]
  irc:
    enabled: true
    var.paths: ["/usr/local/zeek/logs/current/irc.log"]
  kerberos:
    enabled: true
    var.paths: ["/usr/local/zeek/logs/current/kerberos.log"]
  modbus:
    enabled: true
    var.paths: ["/usr/local/zeek/logs/current/modbus.log"]
  mysql:
    enabled: true
    var.paths: ["/usr/local/zeek/logs/current/mysql.log"]
  notice:
    enabled: true
    var.paths: ["/usr/local/zeek/logs/current/notice.log"]
  ntlm:
    enabled: true
    var.paths: ["/usr/local/zeek/logs/current/ntlm.log"]
  ocsp:
    enabled: true
    var.paths: ["/usr/local/zeek/logs/current/ocsp.log"]
  pe:
    enabled: true
    var.paths: ["/usr/local/zeek/logs/current/pe.log"]
  radius:
    enabled: true
    var.paths: ["/usr/local/zeek/logs/current/radius.log"]
  rdp:
    enabled: true
    var.paths: ["/usr/local/zeek/logs/current/rdp.log"]
  rfb:
    enabled: true
    var.paths: ["/usr/local/zeek/logs/current/rfb.log"]
# signatures:
# enabled: true
# var.paths: ["/usr/local/zeek/logs/current/signatures.log"]
  sip:
    enabled: true
    var.paths: ["/usr/local/zeek/logs/current/sip.log"]
  smb_cmd:
    enabled: true
    var.paths: ["/usr/local/zeek/logs/current/smb_cmd.log"]
  smb_files:
    enabled: true
    var.paths: ["/usr/local/zeek/logs/current/smb_files.log"]
  smb_mapping:
    enabled: true
    var.paths: ["/usr/local/zeek/logs/current/smb_mapping.log"]
  smtp:
    enabled: true
    var.paths: ["/usr/local/zeek/logs/current/smtp.log"]
  snmp:
    enabled: true
    var.paths: ["/usr/local/zeek/logs/current/snmp.log"]
  socks:
    enabled: true
    var.paths: ["/usr/local/zeek/logs/current/socks.log"]
  ssh:
    enabled: true
    var.paths: ["/usr/local/zeek/logs/current/ssh.log"]
  ssl:
    enabled: true
    var.paths: ["/usr/local/zeek/logs/current/ssl.log"]
  stats:
    enabled: true
    var.paths: ["/usr/local/zeek/logs/current/stats.log"]
  syslog:
    enabled: true
    var.paths: ["/usr/local/zeek/logs/current/syslog.log"]
  traceroute:
    enabled: true
    var.paths: ["/usr/local/zeek/logs/current/traceroute.log"]
  tunnel:
    enabled: true
    var.paths: ["/usr/local/zeek/logs/current/tunnel.log"]
  weird:
    enabled: true
    var.paths: ["/usr/local/zeek/logs/current/weird.log"]
  x509:
    enabled: true
    var.paths: ["/usr/local/zeek/logs/current/x509.log"]
Activate the module. From the /etc/filebeat directory:
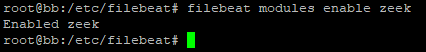
I also enable the system module to keep track of syslog and other linux logs outside of Zeek.
You can list the available modules as well (and see what else can be integrated with filebeat)
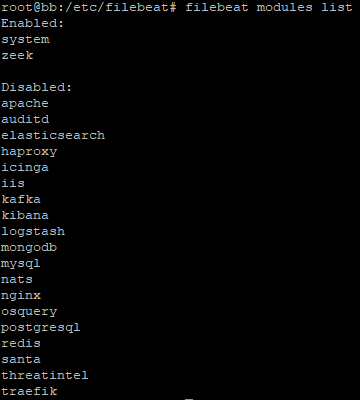
Make sure you restart your filebeat service once the configuration file is modified.
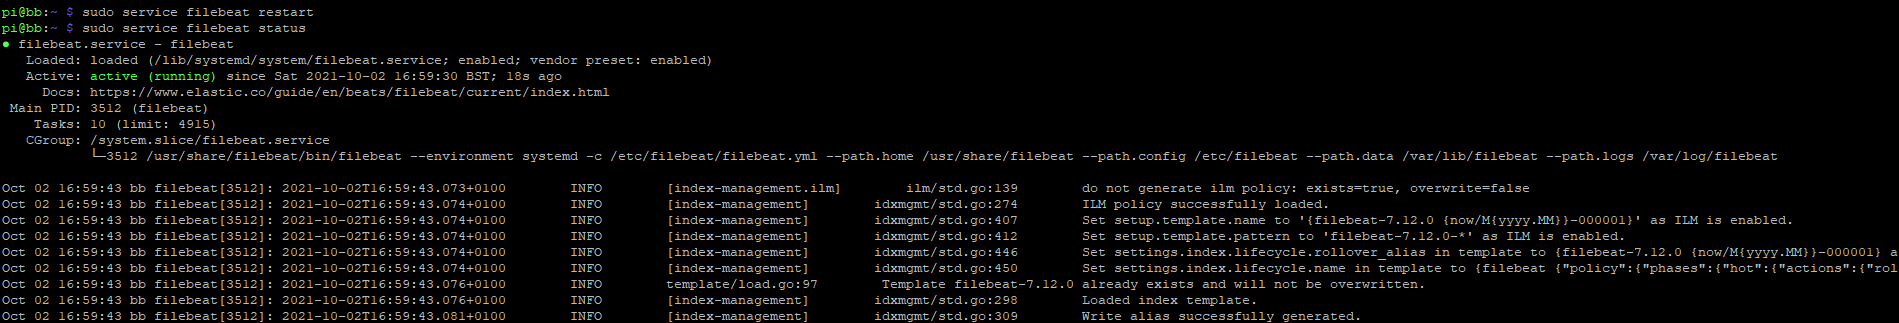
sudo service filebeat restart
An additional useful command: journalctl -u filebeat.service –since “5 minutes ago”
This will allow to see all the startup logs for the service and troubleshoot any issues. Invaluable in case you don’t see any activity on the service or towards your elasticstack.
Checking Elastic for Logs
Lets check to make sure the new logs are making it into Elasticsearch and that we can see them in Kibana. Browse to your Kibana instance and you should be presented with a home page similar to the one below.
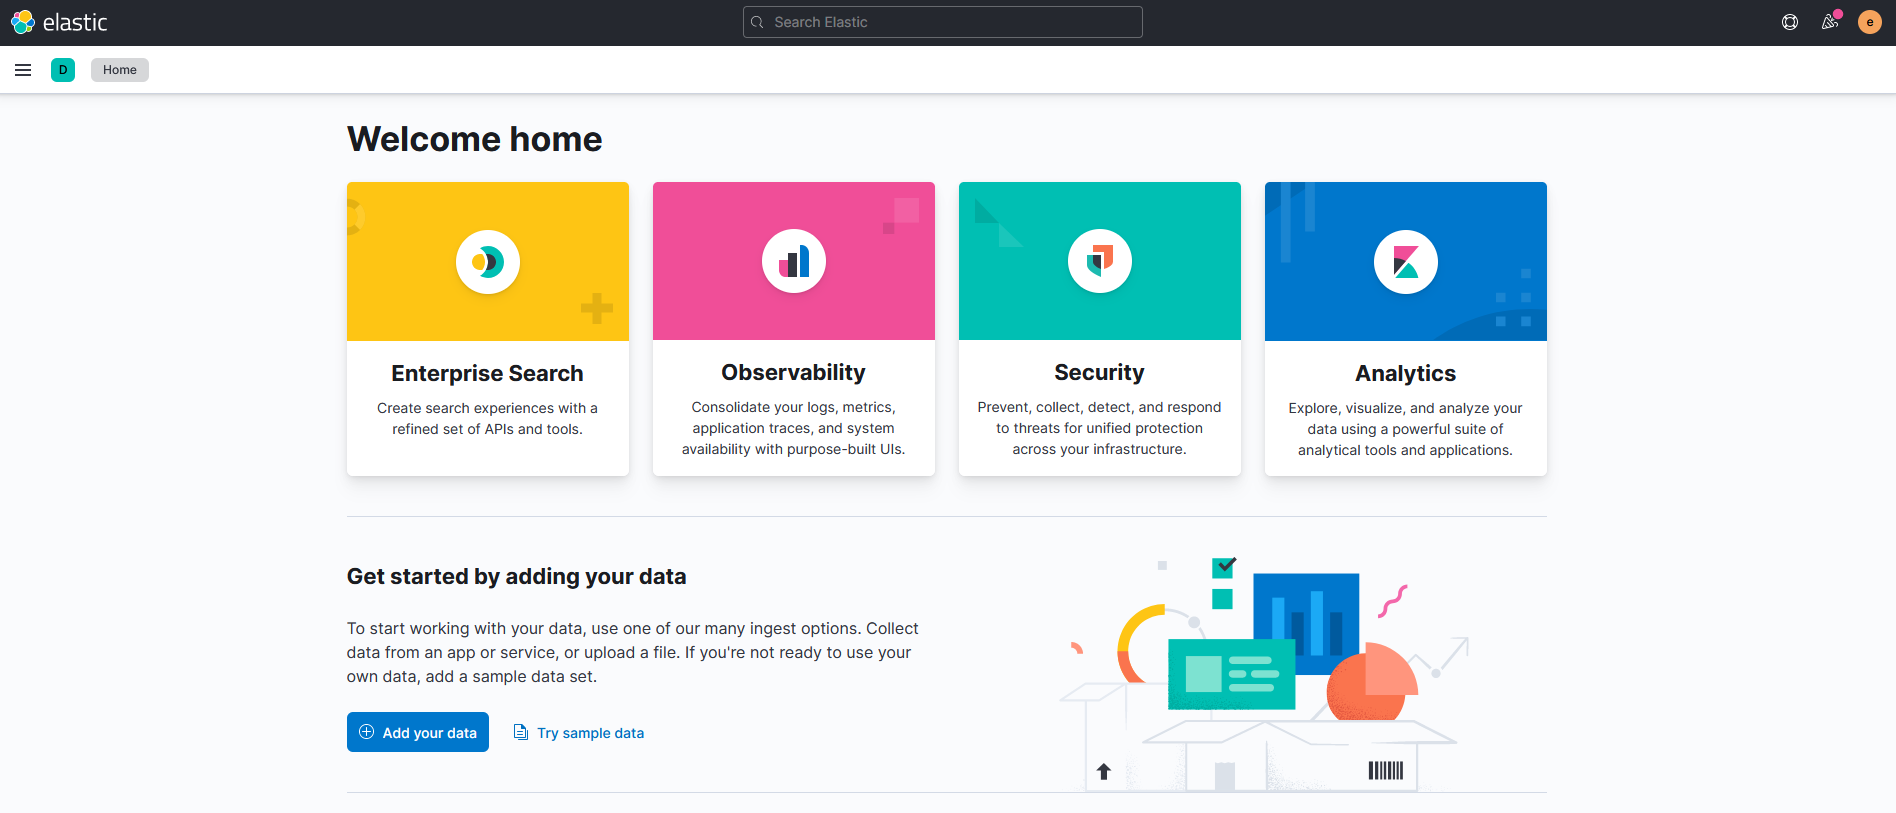
This main menu shows you the fundamental features of Elastic. You can also dive deeper by pressing the three parallel line icon in the top left corner and get more choices:

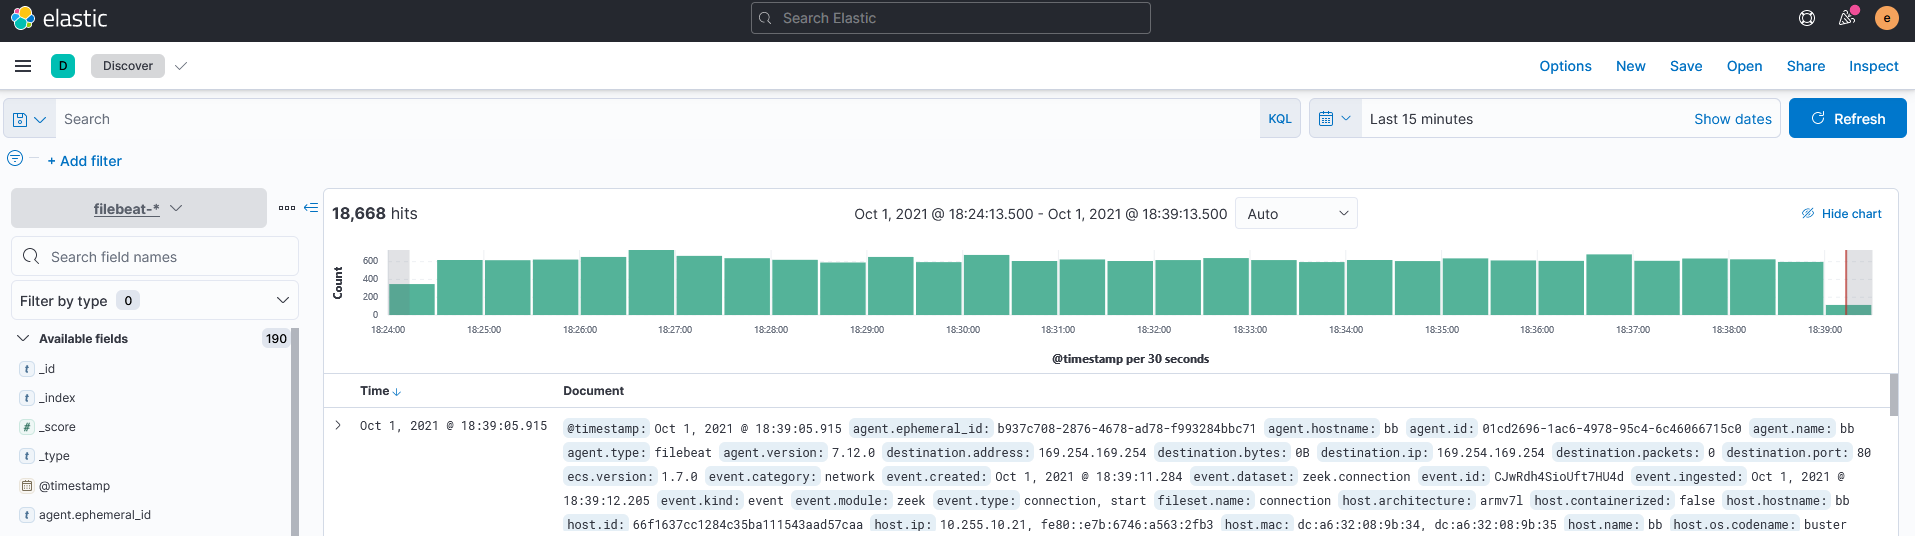
To check whether your elastic server is picking up logs, go to the Analytics Menu and click on Discover. If you see logs, this is good. It should look similar to the image below. If not, recheck your steps above.
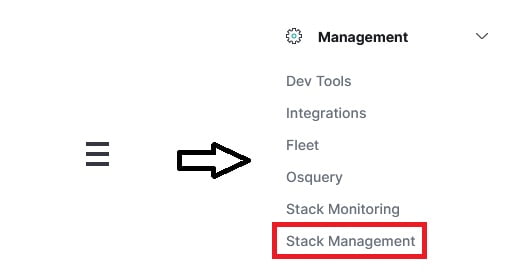
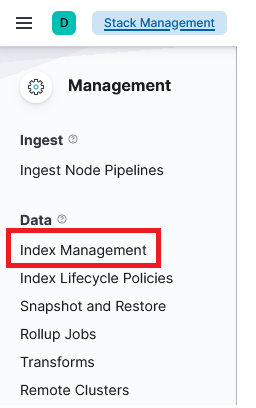
Another tip, in the past Elasticsearch and Kibana don’t necessarily capture all the fields from the messages sent from the Zeek sensor. This is where remaking the index patterns is important once information starts flowing to ensure that elastic is processing your JSON key pairs correctly. You can do this through the Management menu item and click on Stack Management at the bottom of the menu choices. This will bring you to a new page. Once you’re in the Stack Management menu, click on Index Management
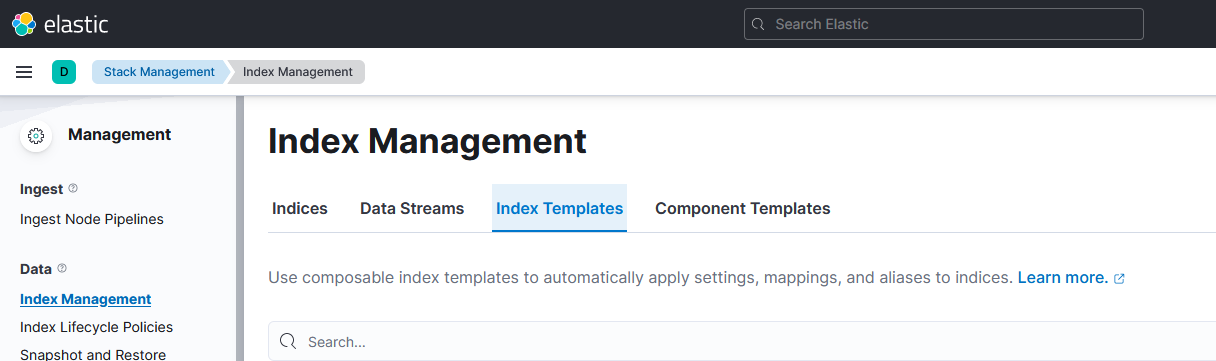
A new page will be loaded, in the top center area there will be some tab choices. Click on Index Templates.
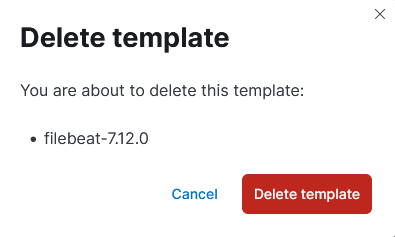
Use the Search bar to look for your index. It’s probably called filebeat-* or something similar and is at the bottom of the page as this is a ‘legacy’ index. Mouse over the template name so that the pencil and trash icons appear. Click on the trash icon to start deleting the index.
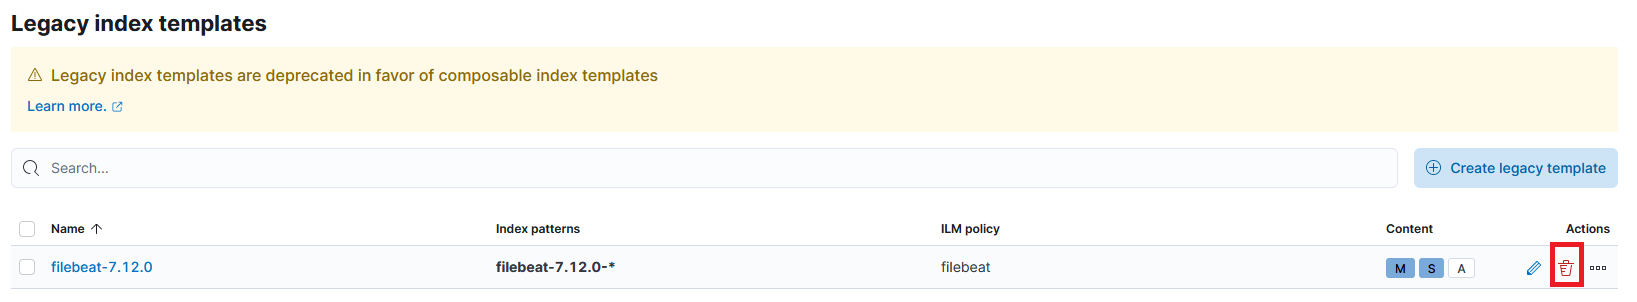
Upon pressing the trash bin, a popup to confirm the deletion will appear. Click on the Delete template button.
Once you have deleted the template, go back to your Zeek sensor and restart the filebeat service, I also check the status just in case it doesn’t come up correctly. Wait a few minutes, refresh your browser screen on the Index Management page and your index should regenerate in the Index Templates menu. Note: You may have to reset filebeat a few times if it’s not coming back up.
Viewing the Security Dashboards
Now we get to the part we’ve all been waiting for, how do we get out data into graphs and tables? Click on the three parallel line icon and choose Security.
If the steps above were followed and successful you should see some additional details in this menu through the Overview tab similar to below.

These bar graphs show different information from the Zeek logs that are being sent. The top graph is for the Elastic internal detection alerts. Elastic has some rules that it uses to detect alerts through the Security -> Rules screen. In this case Zeek is detecting a PPTP VPN attempt on my local network. All sorts of other detection rules can be configured.
The second graph is the threat intel hits from the intel.log and weird.log files from Zeek. If you click on the View alerts button, it will filter the raw logs from the Discovery page for further analysis.
You can then scroll down further and see some of the more nitty gritty statistics from the ingest pipelines going into your Elastic instance. In this case since i’m only using Zeek and filebeat it will only show results from those applications. The top graphs can be drilled down further for the different types of logs (IE DNS, SSL etc).

Other logs can be added and if you scroll down further a new functionality around Threat Intelligence can be added. Click through the different screens on the Security menu to view more visualization options. One that always gets oohs and ahhs from the more network inclined folks is the hosts map where Elastic can use the geolocation of logs to show traffic between points on a world map, top talkers from source and destination IP perspectives and top traffic to different countries.
I sincerely hope this has helped you on your journey to better visualize your Zeek information. let me know in the comments if you have come up with other visualizations or ways of doing things.
Stay safe
–David
6 Responses
i get stuck at
$ make go build -i
with message saying
“make: *** No rule to make target ‘go’. Stop.”
any chance you can help me out ?
my setup is similar to yours just that my installation goes to the /opt folder and not /usr/local
Hi Dave,
Thanks for the great tutorial series of Zeek zetup on ARM and all the way up to logging visualisations.
I did skimed through all – all blog images are missing on my end. For the other zeek tutorials does not matter but for this one I really would like to see how you reports look like. On all Image places I can see “?” mark and they point to for example: “https://res.cloudinary.com/peerlyst/image/upload/c_limit,dpr_2.0,f_auto,fl_lossy,h_108,q_auto,w_890/v1/post-attachments/visualize_lqmqws”
But do not load in Safari/
Just wanted to let you know.
Keep the good work!
Martin
What version of Raspberry Pi did you use in this setup? Good guide by the way.
I have a Raspberry Pi 4 with 4 GB RAM, and everytime I try to ‘make’ Zeek, the build gets to about 40% and then ccp1plus crashes. A quick ‘dmesg’ command reveals the OOM Out of Memory Error. I was recommended to use Clang instead of GCC for compiling at ./configure due to lower memory usage, but I crashed that way too at 70%.
What do you recommend I do next? I have no experience or knowledge in cross-compiling…